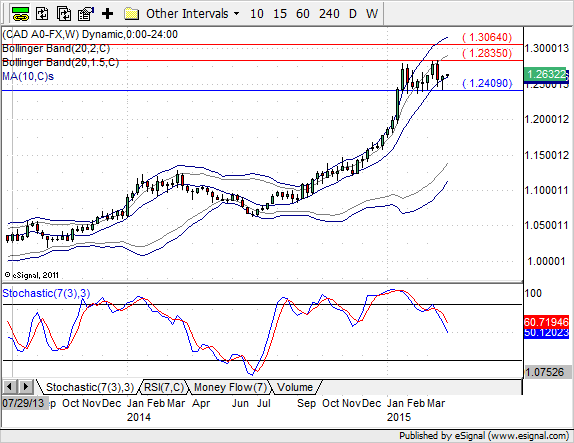
USDCAD (weekly) has been moving sideways since the beginning of February. The proximity of the year 2009 high has caused the sideways move. I suggested in my analysis at the time that USDCAD should move above the latest highs as US economy is stronger than the economy in Canada. The fact that USDCAD has maintained the support well and has now created a weekly hammer candle at the support supports my view. Bears might point out that Stochastics oscillator and RSI (7) have created lower highs and therefore signal that the momentum is waning. This however, is what happens each time price moves sideways. Therefore, oscillators do not tell us anything we wouldn’t know by reading price action. Nearest support and resistance levels are at 1.2409 and 1.2835. The year 2009 high at 1.3064 would be the next major resistance once price moves beyond the 1.2835.
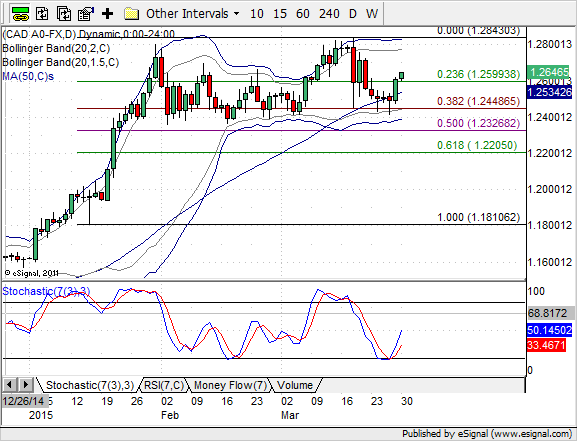
USDCAD, Daily
Price action in the daily chart points to the upside. USDCAD has found support from the area near the 38.2% Fibonacci level and the lower Bollinger Bands. Last week Stochastics moved to oversold territory and the 50 day moving average catched up with the price. Friday’s close well above the hammer candle high was a bullish sign and created a hammer candle in the weekly chart as well.
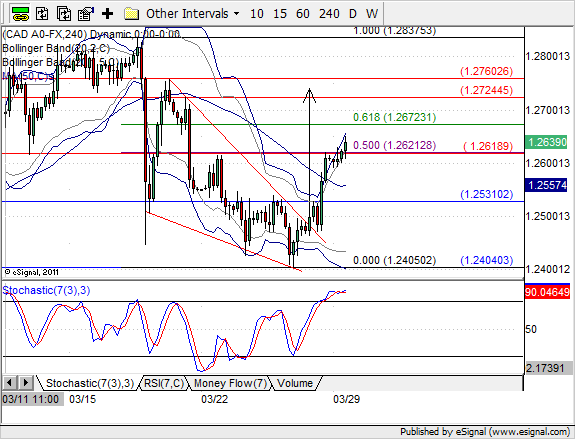
USDCAD, 240
After being held back by the 50% Fibonacci level and a pivot high price is now breaking higher. This is very much in line with the bullishness in daily and weekly charts. The pair broken out of the wedge formation and projection from the formation points to the resistance zone between 1.2724 and 1.2760. Support levels are at 1.2621, 1.2531 and 1.2409.
Conclusion:
Long term technical picture is bullish as institutional buying has created a hammer candle at the support. The latest weekly low was also higher than the pivot low in the weekly chart from the mid February. Short term picture supports this as price has broken out of a wedge formation in the 4h chart and has closed above the Friday’s daily hammer candle. As the setup in the higher time frames is favourable I am looking for pullbacks to technical levels at 60 and 15 min charts. The range at 1.2724 – 1.2760 is my target for this price move. - HotForex experts said(rated among the TOP Forex Brokers Masterforex-V World Academy http://www.masterforex-v.com/).